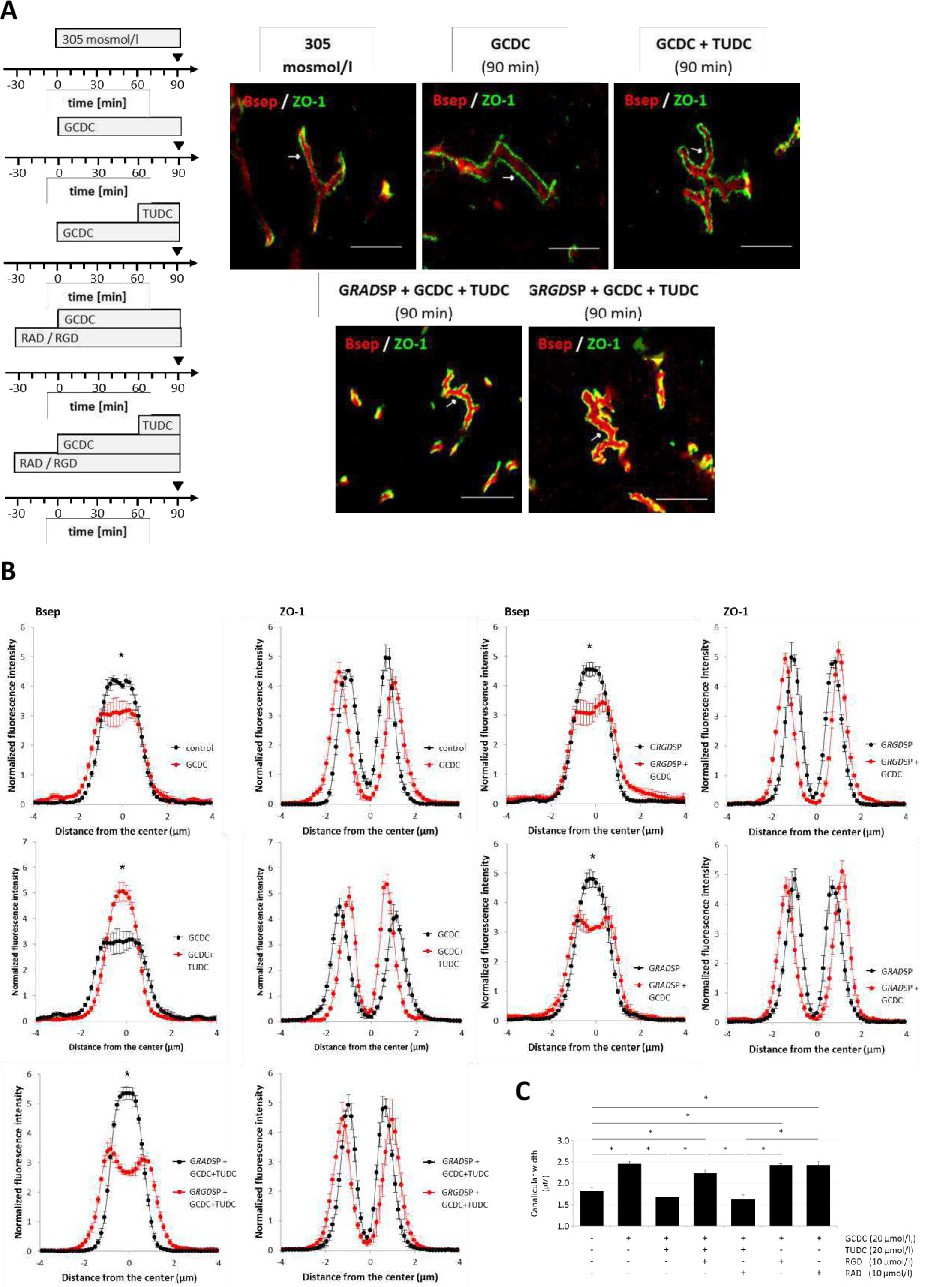
Fig. 8. Effects of GCDC on the subcellular distribution of Bsep and ZO-1 in perfused rat liver. Rat livers were perfused with Krebs-Henseleit buffer in presence or absence of GCDC (20 µmol/l) and/or TUDC (20 µmol/l), GRGDSP (10 µmol/l) and/or GRADSP (10 µmol/l) as indicated in the perfusion plan. (A) Bsep and ZO-1 were visualized by confocal laserscanning microscopy at t = 90 min. Representative images from 3 independent experiments are shown. The scale bar corresponds to 10 µm. (B) Densitometric analysis of fluorescence intensity profiles of Bsep and ZO-1 staining at t = 90 min. GCDC induces dilatation of the canaliculi as suggested by an increased distance between the ZO-1 peaks. (C) Canalicular width as measured by the distance of ZO-1 peak immunoreactivities between the canalicular borders. Data consist of arithmetric means ± SEM of 10-30 measurements in each of 3 individual experiments for each condition. * statistically significantly different to control.